SCIENTIFIC BACKGROUND
The DDI Framework is based on a scientific approach, co-developed with the Technical Universities of Munich and Berlin and the Big Data Value Association.

The corresponding data set was obtained from an empirical study of more than 90 data-driven business models. The goal of this scientific research was to identify the patterns of successful data-driven companies in order to extract key variables for companies.
SUCCESS PATTERNS
In order to understand typical success patterns of data-driven innovations, our research study relied on unsupervised cluster analysis.
Based on the cluster analysis, we could identify six clusters:

Cluster A: “Data Pre-Processing”
The central focus of companies in the Cluster A “Data Pre-Processing” is on delivering solutions for the pre-processing of heterogeneous data sources, such as images or videos. Due to the high technical complexity, companies tend to be very focused and do not provide additional analytics or automation capabilities. In addition, as companies of this cluster seem to focus on generic technical challenges without concrete customer value in mind, they are developing twice as often sector agnostic solutions compared to the overall sample.

Cluster B: “Internet-of-Things applications”
Start-ups of the Cluster B rely on Internet of Things (IoT) technology as part of their offerings. As the IoT technology is integrated with multiple types of technologies as well as different types of data analytics, startups in this cluster are confronted with challenges in data pre-processing and data integration. Although companies of this cluster rely on industrial data twice as often as others and tend to use different kinds of data sources, they are less likely relying on unstructured data.

Cluster C: “Industrial services”
Companies of Cluster C are characterized by heavy usage of industrial data sources. The usage of unstructured data is less frequent in comparison to the overall sample. In terms of their value proposition, they tend to cover the whole range of data analytics as well as provide high value through process automation. Companies of this cluster seem to be prepared to make use of available services for processing IoT data, but do not include IoT technology as component of their overall offerings.

Cluster D: “Descriptive value”
Companies in Cluster D are focused on descriptive analytical services for non-industrial data sources. The usage of other analytical services is significantly lower compared to the average sample. The same is true for match-making functionalities or process automation capabilities. In addition, Cluster D companies are more likely to rely on semi-structured data from media and time series. All Cluster D offerings are positioned in the market as data-driven services and are generating income mainly by a subscription model (94% of the offerings).

Cluster E: “Predictive value”
All Cluster E companies focus on predictive analytics, often combining other analytical values such as descriptive, diagnostic or prescriptive data. Compared to the average in our sample, they are 50% more likely to rely on unstructured data sources as well as 33% on personal data. They do not use industrial data at all. By relying on a smaller number of different types of technologies, they are confronted with less integration efforts, interfaces and partners. For generating revenues, they rely 50% more often on asset sales or selling of services and less frequently on subscription models.

Cluster F: “Match-Making value”
The main value proposition of Cluster F startups is their match-making functionality, allowing them to connect the market side (supply & demand) with business and consumers. Start-ups in Cluster F are very likely to rely on commission fees (60% compared to 10% in average). They harness network effects on marketplace level and establish multi-sided markets / data-driven marketplaces. The high usage of personal data (87%) indicates that personal data is used for implementing match-making algorithms also in B2B marketplaces.
RESEARCH
The DDI framework was developed and tested in the context of the Horizon 2020 BDVe project and is backed by empirical data and scientific research encompassing a quantitative and representative research study covering more than 90 data-driven business opportunities. The objective of our research study was to systematically analyse and compare successfully implemented data-driven business opportunities.
From the research study, we could derive findings along the main dimensions of the DDI Framework:
Target User – Findings
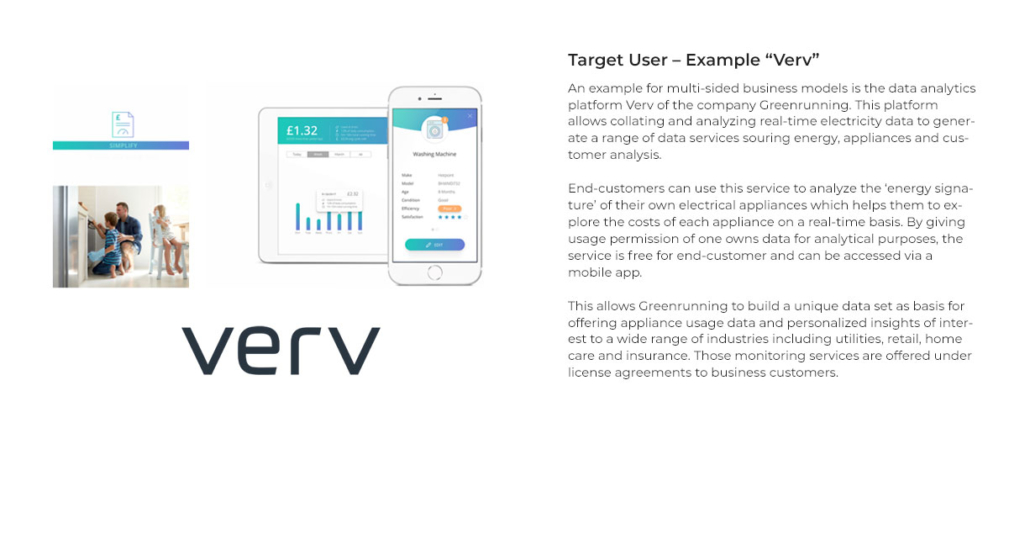
The majority of data-driven start-ups (78%) are addressing B2B markets. Only two out of 90 start-ups of our sample focused on end-customer markets solely. Start-ups addressing end-user needs prefer already established channels to deliver their offering to the users. They tend to rely on partnerships established business partners to bring their offering to users. A second quite frequent strategy used by 19% of start-ups is position data-driven solutions as multi-sided market combining complementary offerings to align private and business needs. 75% of our start-up sample have developed a clear sector focus. Companies with clear sector-focus have a concrete customer segment(s) in mind for whom a concrete value proposition is delivered. In comparison, we also find start-ups that focus on technology with cross-domain impact. In general, their solution will be used by other intra- or entrepreneurs to build data-driven solutions for end-user.
Please see below for some best practices & examples.
Value Proposition – Findings
Two in every three start-ups rely on data analytics in general for generating insights. Among the start-ups using data analytics, 83% rely on descriptive analytics in their offering (i.e. every second start-up).
Compared to descriptive and predictive analytics, we can observe that diagnostics and prescriptive analytics are used in less frequency.
Only every fifth data-driven start-up is offering solution for automating manual tasks or activities and match-making is observed only in 16% of the cases.
Please see below for some best practices & examples.


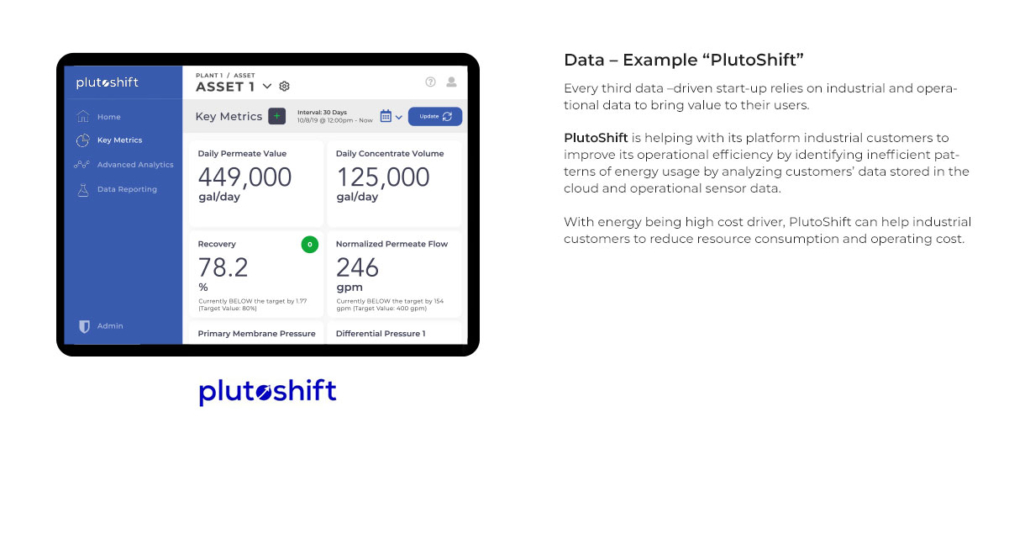
Data – Findings
Although only 19% of start-ups were addressing B2C markets, personal data was still the most frequently (67%) used in the analysed data-driven offerings.
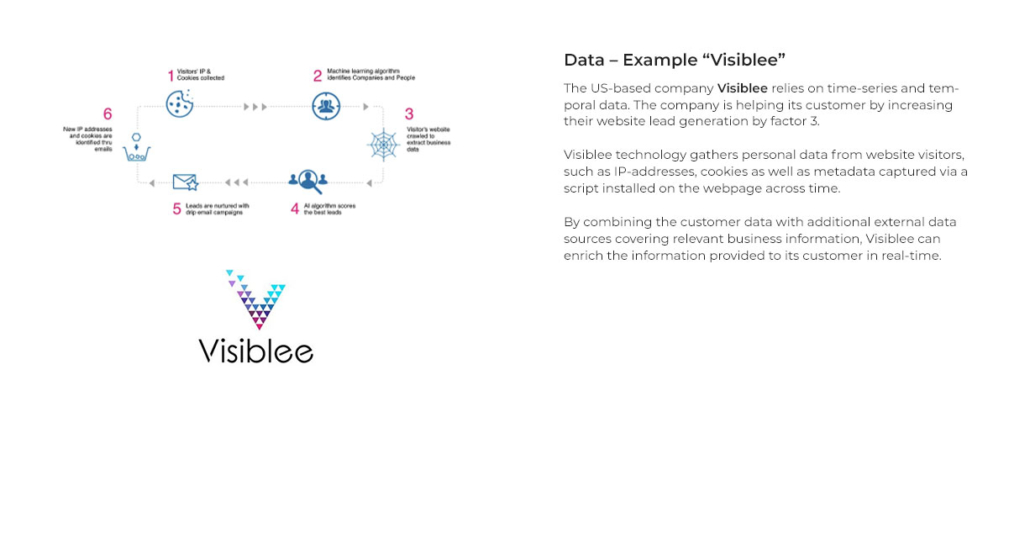
A second very popular type of data source are time-series and temporal data. 56% of start-ups in our sample rely on this type of data to generate value.
The high frequency might be due to the popularity of using behavioral data that is tracked within each user interaction on the web and mobile devices and thus very likely to cover time-series data.
Another very frequently used data source are geo-spatial data with 46% and the usage of Internet of Things (IoT) data is seen in 30% of our sample. Industrial data sources have only been used half as often in compared to personal data, and open data only half as often compared to industrial data.
Please see below for some best practices & examples.
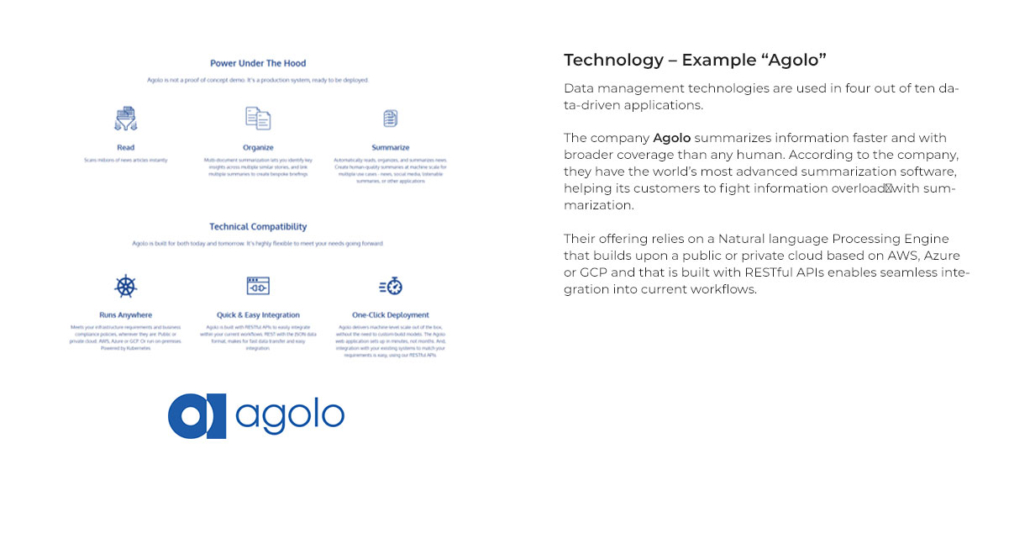
Technology – Findings
Among the five technology areas listed in the Strategic Research and Innovation Agenda (SRIA), Data Analytics is used most frequently used. 82% of our start-up sample relied on some type of data analytics to implement data-driven value proposition.
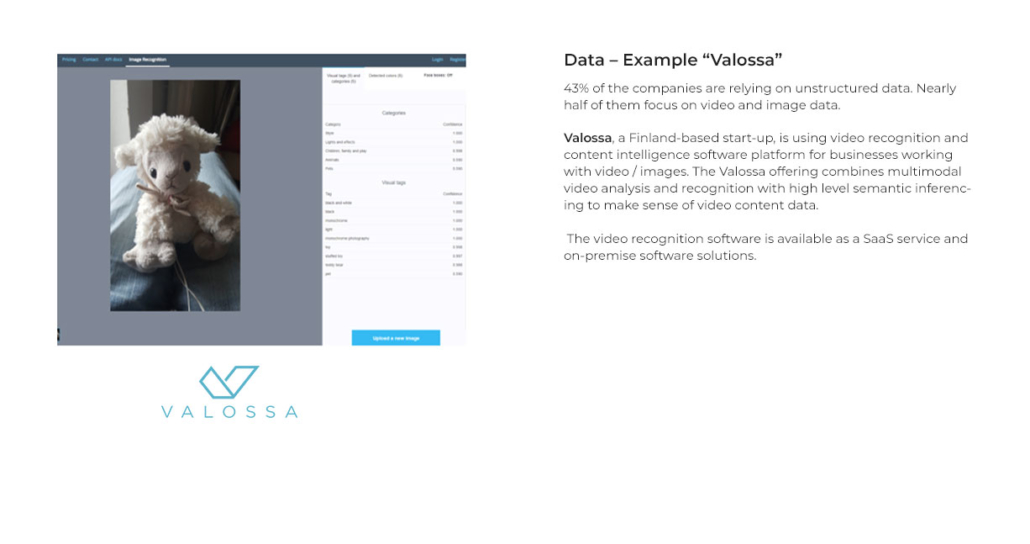
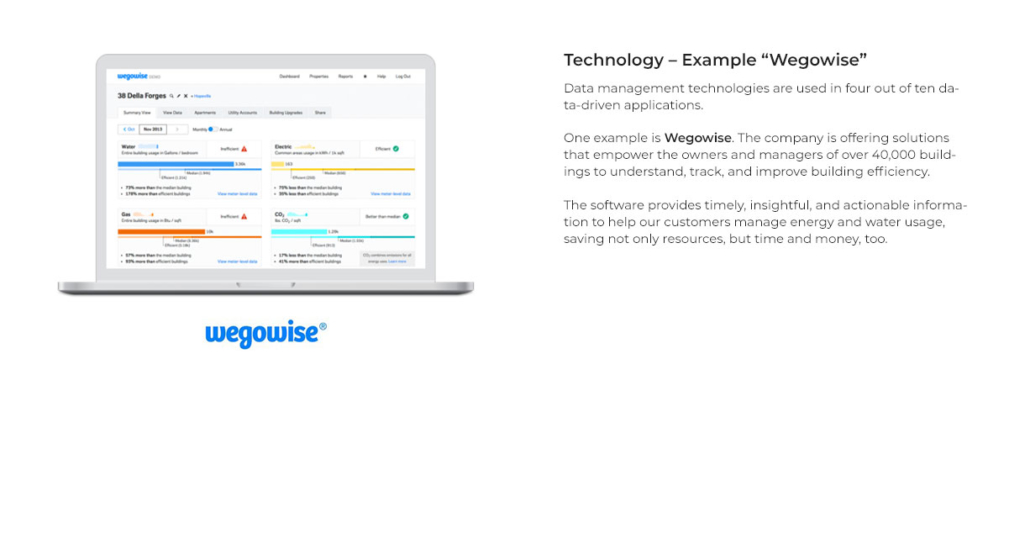
The usage of technologies of the Data Management area is seen in 41% of the cases and is very much in line with offerings addressing the challenges of processing unstructured data sources.
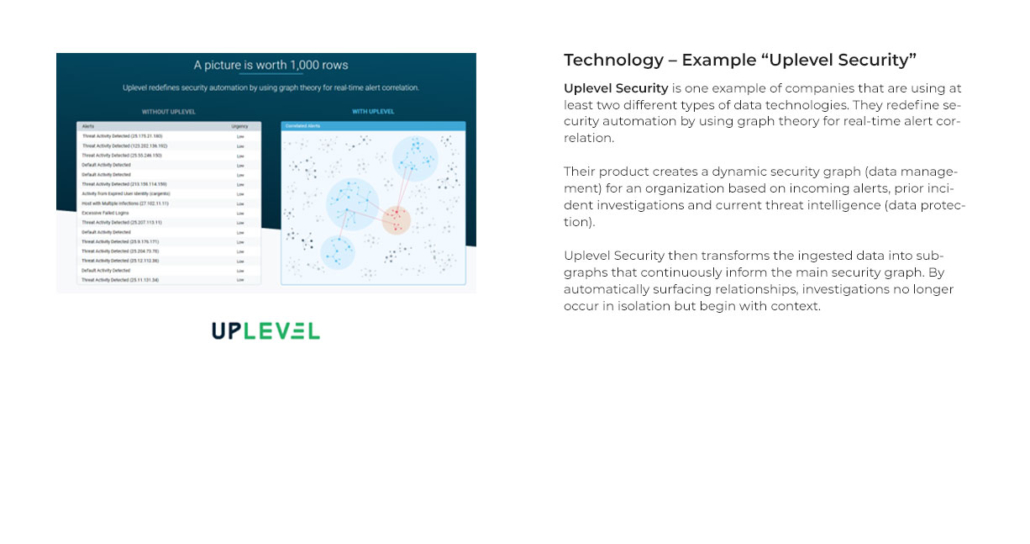
Solutions for Data Protection are the least frequently addressed research challenge with 13%. When looking to which extend BDV SRIA Technologies are used in combination, we observed that more than half of the start-ups, precisely 59%, combine more or equal than two technologies, but only 22% combine more or equal than three SRIA technologies.
Please see below for some best practices & examples.
Network Strategy – Findings
For digital and data-driven innovations, network effects are important phenomena to be reflected. In our study, 57% of start-ups rely on network effects. We further distinguished three different levels of network effects.
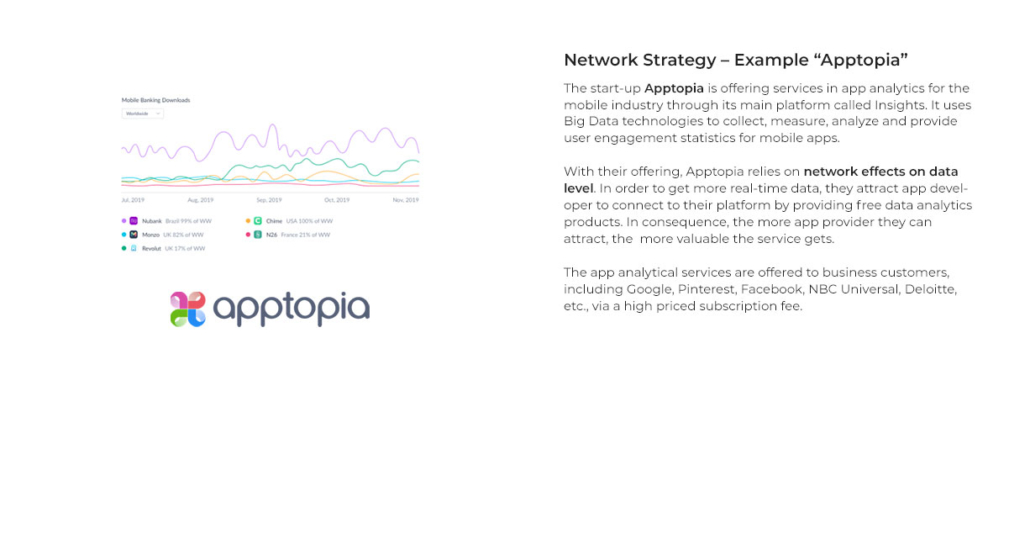
First, when data-driven businesses can improve their offering the more data they have available, they are relying on network effects on data level. In our sample this was the case in 49% of start-ups.
Second, when businesses are providing a technical foundation for others to build upon, network effects on infrastructure level can be observed. In our sample these have been 12% of the start-ups.
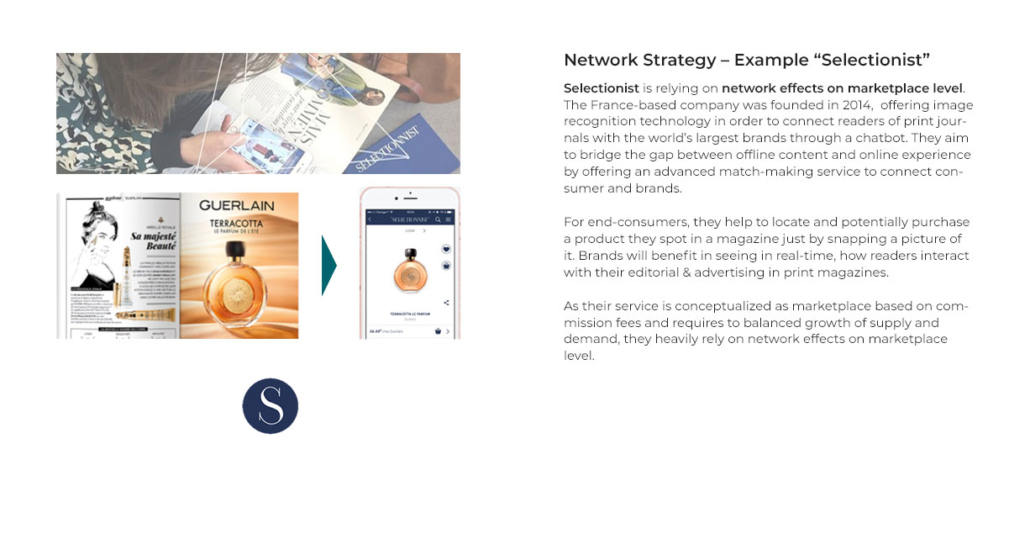
Third, in cases where the number of marketplace participants is the key source of value, data-driven offerings can harness network effects on marketplace level. The low number of network effects on marketplaces in our study of 10% indicates the high challenges of building them.
Please see below for some best practices & examples.

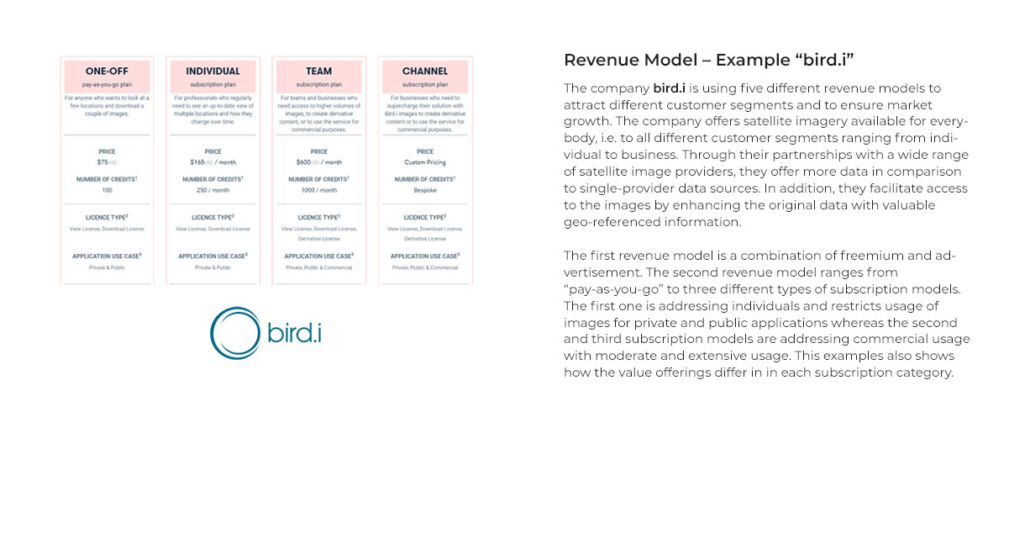
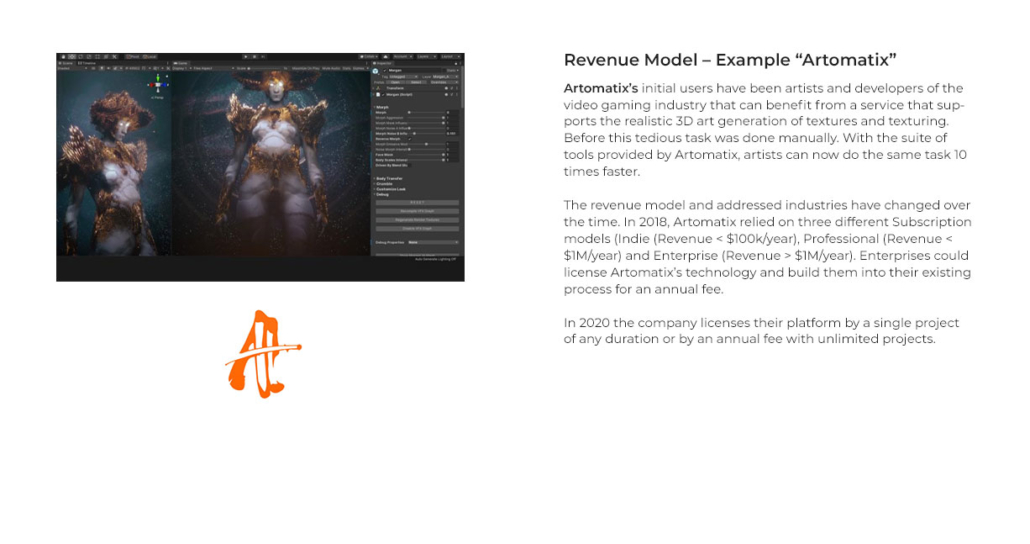
Revenue Model – Findings
In our study, information about the type of revenue models used was difficult to find. Especially in cases when start-ups have been focusing on emerging technical advances, such as drones or autonomous driving, information about revenue models was not available.
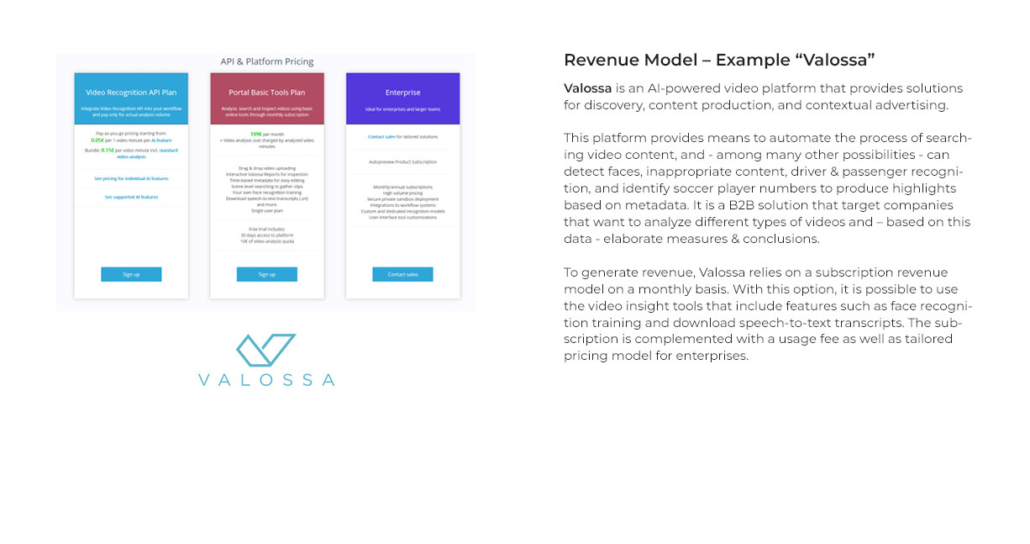
Still, the most frequently used revenue model in our study was the subscription model. We observed a strong correlation with the spread and high adoption of Software as a service (SaaS) approach, which brings a lot of flexibility when using for deploying data-driven innovation.
The second most frequent revenue model was selling of services in which the person’s time is payed for. Those revenue models were very often used for open software offerings as well as when offerings are not standardized or off-shelf.
Advertisement as a revenue model was rarely observed. In our sample, only 2% of the start-ups were applying it. Although it might seems surprising, it only reflects the high percentage of B2B models in our sample.
Please see below for some best practices & examples.
Type of Business – Findings
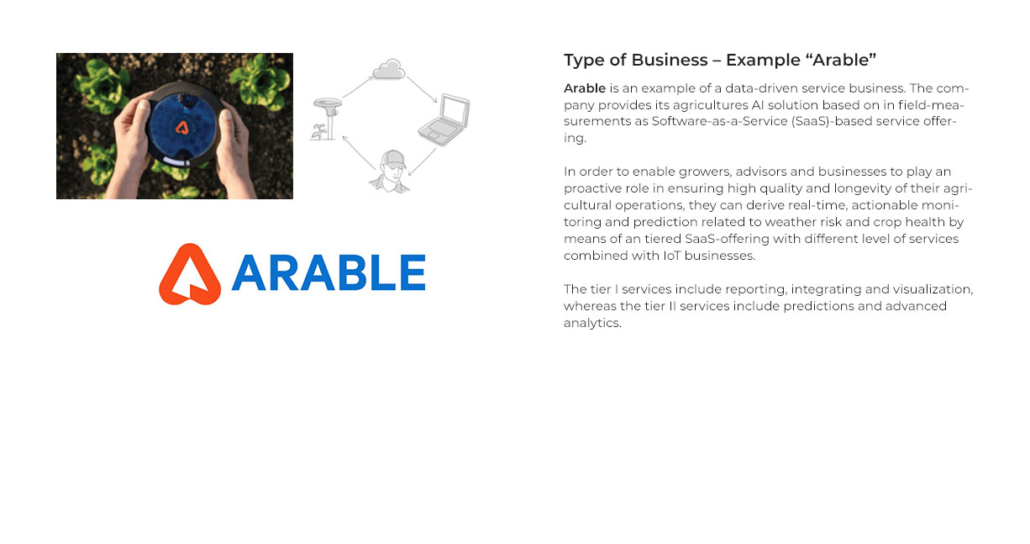
When positioning data-driven offerings on the market, one requires to reflect the associated business or innovation ecosystem. Data-driven service businesses that focus on establishing a partnership with one new business partner have been the most frequently used within our study. 78% used this strategy position their data-driven offering on the market.
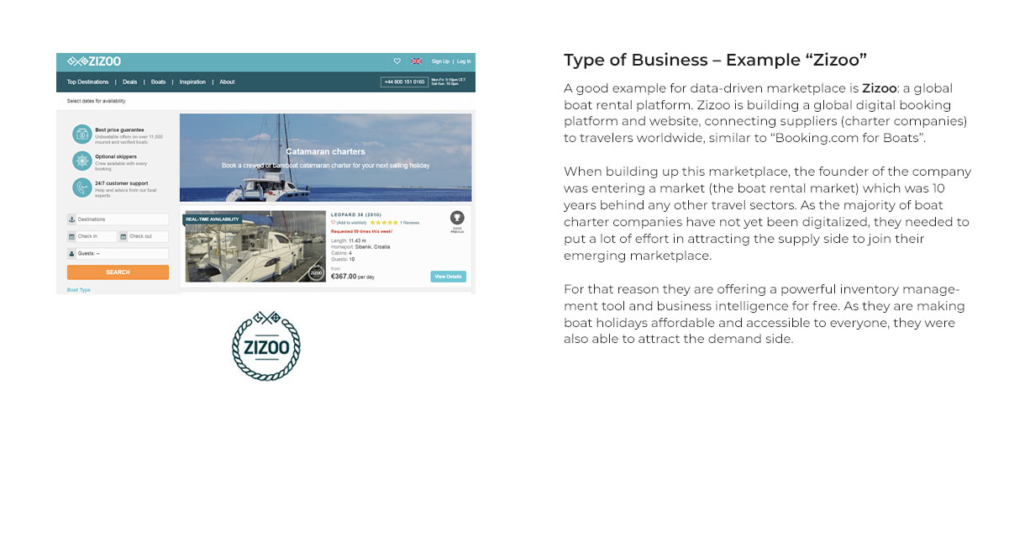
Compared to data-driven services is the development of data-driven marketplaces significantly more complex as a new marketplace / ecosystem need to be built up. Only 16% of companies in our sample relied on this approach.
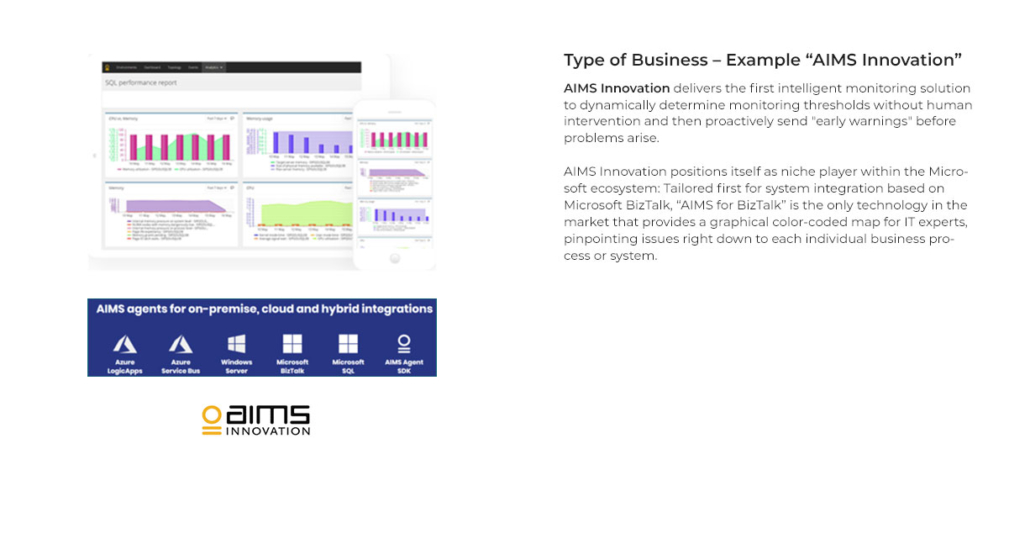
Another strategy is to identify an existing healthy ecosystem that is already in place which gives the opportunity to position the own offering as niche application. In our sample this strategy was observed in 12% of the cases.
Emerging technology businesses focus on technologies in a very early stage and anticipate a future ecosystem or not yet settled market. In our study it was seen in 9% of the case.
Please see below for some best practices & examples.